On this page · 5 sections
In short
Being at the 12th, the 48th or the 98th percentile is neither good nor bad: there are healthy babies at every one of them. What deserves attention is the trend (a fast or sustained drop that crosses two major lines on the chart, for example from p50 to p25 and then p10 within a few months) and, above all, a baby who seems unwell, feeds poorly or has few wet diapers. Small ups and downs are normal, but what always counts most is your pediatrician's opinion: they know your baby far better than a single number does.
When a baby is born, we all become percentile experts overnight, following every gram our little one gains as if it were a carefully planned elite training program.
Understanding the numbers and keeping an eye on how our baby is growing is certainly important and worthwhile. But so is keeping our heads, and not panicking because, all of a sudden, our baby is at the 45th percentile and hasn't quite reached the 50th.
What a percentile is (and what it isn't)
A percentile simply tells us how many babies of the same age and sex weigh (or measure) less than ours. If your baby is at the 32nd percentile (p32), then out of every 100 babies the same age, about 32 weigh less and about 68 weigh more.
And that is only natural: there are taller and shorter people and children, and there always will be. Being at percentile X and perfectly healthy is the norm. There will always be healthy babies at the 98th percentile or the 12th; that's just how nature works.
The charts your pediatrician uses (and our calculator) are the WHO charts, built from healthy, breastfed babies from six countries raised in good conditions. They describe how a healthy baby grows, not how yours "should" be. The 50th percentile is not a passing grade, and the 90th is not an A+.
It's the curve that matters, not the number
A single measurement, apart from birth weight, usually says very little. What pediatricians really look at is the line that the measurements draw month after month. And it is normal for that line not to be perfect, but to wobble a little: weighing a baby in a full or an empty diaper, before or after a feed, in a bodysuit or without one, or on a different scale, all give slightly different numbers.
A cold, or a week of poorer feeding because teeth are coming in, for example, also shows up and makes the measurements vary.
Small ups and downs within their band. This is what you will see in most babies.
Crosses two major lines within a few months. Not an emergency on its own, but something to look at with your pediatrician.
Two situations look scary and are often normal. The first: in the first days almost all newborns lose some weight and regain it by around two weeks. Those first two weeks do deserve a close watch, so there are no big jumps in percentile, but what really reassures us is seeing the baby settle into one line.
The second: during the first year and a half, some babies drift from one lane to another until they find their own: a big baby at birth, with small parents, may slide down gently with nothing wrong at all. That is why the pediatrician looks at the whole picture, not at a single measurement.
 Raffy · free on Android
See their curve, not a loose number
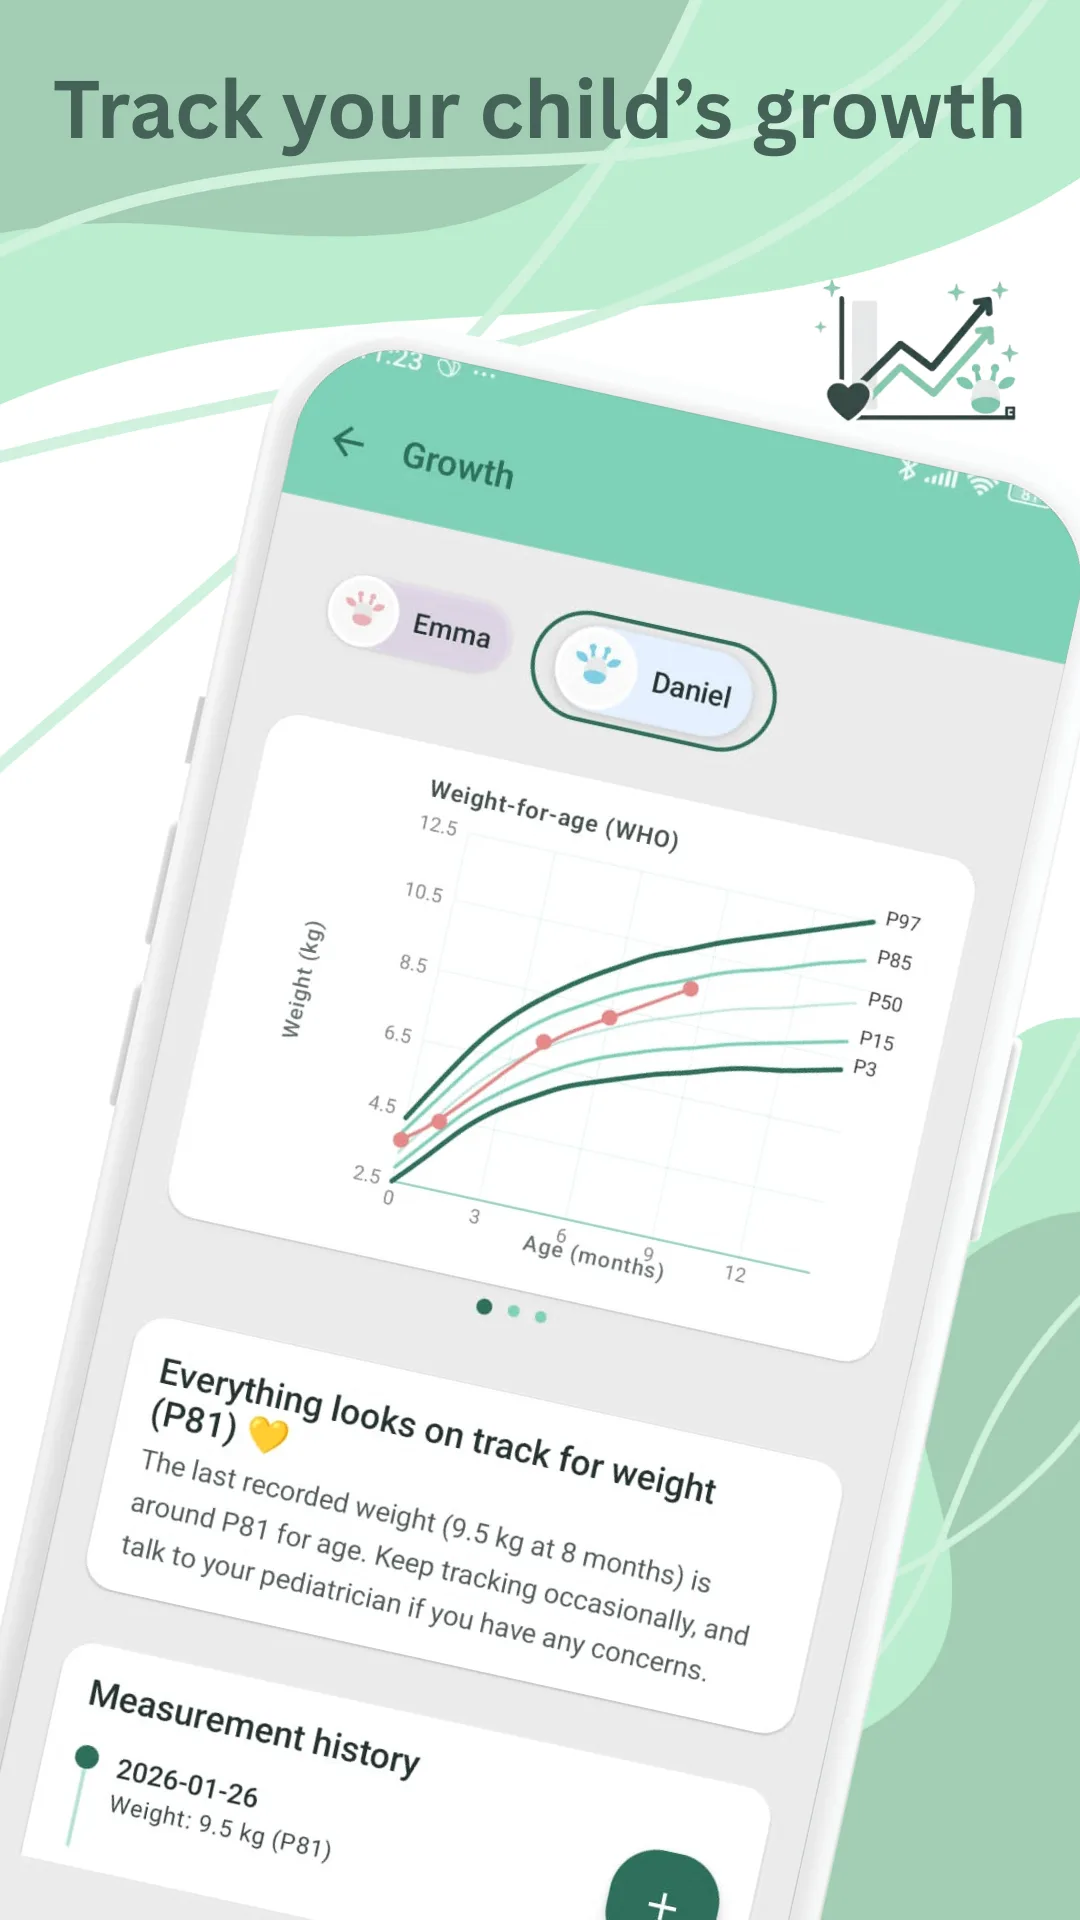
Log weight and length in Raffy and watch their growth on the WHO curves.
When you should worry
We should worry, of course, if the pediatrician tells us something looks concerning. And it will almost always show up first in how the baby is doing: we see them with little energy, listless, not feeding…
A sudden drop in percentiles, or a bigger and sustained one, can also be worrying. We are not talking about going from p48 to p45 and then p42, which is normal, but about falling from p50 to p25 and then p10 in a short time, crossing two major lines on the chart.
Pediatric safety: call your pediatrician if
- Your baby is listless, very sleepy, hard to wake for feeds or refusing feeds.
- Few wet diapers (from the first week on, fewer than 6 wet ones a day), or vomiting or diarrhea that does not settle.
- Birth weight has not been regained by about three weeks of age.
- Their curve falls fast or steadily and crosses two or more major lines.
- They are below p3 or above p97 and moving further away.
- Weight and length follow very different paths (for example, length at p75 and weight at p10).
Don't wait for the next check-up if your baby is lethargic, not responding as usual or shows signs of dehydration (sunken soft spot, dry mouth, many hours without a wet diaper): go to the emergency room.
This guide is educational and does not replace your pediatrician's assessment; they know your baby and their history.
How to keep track without obsessing
With everything we have covered, the idea is simple: measure sensibly, look at where the curve is heading and don't let a single number cost us sleep. A few tricks that help:
- Weigh them in similar conditions: same scale, same time of day, same clothes (or none).
- Wait until you have at least three measurements before drawing conclusions.
- Note the context: a cold, a change in feeding, a rough patch with feeds.
- Bring the curve to the check-up, not just the latest number.
If you want to know which percentile your baby is at today, use our WHO percentile calculator. If you want to understand the charts properly, read our guide to baby weight and height percentiles. And if you want to see the whole curve without doing the math, that is what we built Raffy for.
Sources
- World Health OrganizationChild growth standards
- American Academy of Pediatrics · HealthyChildren.orgUnderstanding Growth Charts: A Parent's Guide to Percentiles & Z-Scores
- NHS (UK)Breastfeeding: is my baby getting enough milk?
- NICE (UK)Faltering growth: recognition and management of faltering growth in children
We checked this article against these sources on Oct 27, 2026. It is educational, not medical advice. Editorial policy